(770) 344-0172
(770) 344-0172
Jul 29, 2022
On Thursday morning, the Bureau of Economic Analysis (BEA) reported that gross domestic production (GDP) in the US fell at a -0.9% annualized rate following a -1.6% decline in Q1. These reports are noisy and can be complicated to decipher. As with any of these statistics, there are moving parts and people on either side of the aisle can find data points that “clearly” support their opinion. In this blog post, I will discuss:
While the tone of this blog may be negative, I assure you that I am trying to look objectively at the data and explain in clear language how I see it.
Why Q2 GDP was better than feared
The Atlanta Federal Reserve Bank attempts to track GDP growth in real-time using incoming data. You can find their estimates here. In the days leading up to the report, the Atlanta Fed was tracking to a -1.2% GDP number. We came in at -0.9%. Wall Street Banks had estimates that were much higher but I think the real market consensus was that we’d be down at least 1% and maybe significantly worse.
Embedded in that report was a -2.0% headwind from inventory drawdowns. This gets a bit technical but it basically means that the US is draining its pantry because it had bought too much stuff and the pantry was overfilling. Personal Consumption was actually up +1.0% in the quarter.
Additionally, inflation came in at 8.7%, much higher than the 8.2% reported in Q1. For some reason, economists anticipated 8.0% (which didn’t make much sense to us). When the government comes up with its GDP calculation they take the raw dollars and then adjust it for inflation. For example, in Q1, the raw “nominal” dollars were up 6.6% but we ended up being deflated down to -1.2%. In Q2, the nominal dollars were up 7.8% and we ended up being deflated even further, to -0.9%.
You add all that up and maybe Q2 GDP wasn’t all that bad. Or so the argument goes.
The labor market argument for why we are not in a recession
The argument for why we are in a recession is pretty clear – two consecutive quarters of GDP decline. So why are some well-respected economists in high positions of power saying that we are not? They point to the jobs numbers. They find an unemployment rate of 3.6% incompatible with a recession. And, to be sure, it does seem odd. They say that this is anomalous and doesn’t line up with history.
Respectfully, I disagree.
Jobs are a lagging indicator. You make decisions with people’s livelihoods only after you’re sure there is no other way. Okay, if you’re Amazon, maybe you fire 99,000 employees (6% of the workforce) in Q2 to get ahead of it. But many companies aren’t that brutal. And many companies haven’t burned through $23.5 billion of free cash in the past year. This is not a hit against Amazon – it’s a smart business decision but it illustrates how difficult it actually is to lay people off.
For perspective, when the Global Financial Crisis recession began in December 2007 (according to the NBER), the unemployment rate was 5.0%, only a few tenths above the cycle low in 2006. Unemployment didn’t peak until October 2009 and we didn’t get back to 5.0% until September 2015. In other words, we didn’t hit maximum unemployment until 7 months after the market bottomed and when the recession started, employment was in a relatively good spot.
Again, back in December 2007, the 4-week moving average of initial jobless claims as 349k, up from a cycle low of 290k in 2006. Today, initial filings for unemployment are averaging 249k per week, up from a cycle low of 170k at the end of March.
The bottom line: using jobs numbers as an indicator of recession is poor economics. Jobs numbers tend to be strong at the start of a recession and take a while to really fall off.
What we can expect going forward
In the GDP print were a few stats I do not like to see:
Goods spending is clearly trending down, falling from +1.1% to -0.3% to -4.4% over the past three quarters. That isn’t much of a surprise but it isn’t good. Services spending ticked up but is very noisy going from +3.3% to +3.0% to +4.1% over the past three quarters. Recall, in Q1 we had a large spike of COVID in January and in Q2, we lifted mask mandates on planes and people went out to restaurants en masse. And we only accelerated 1.1% over the prior quarter? Although the number moved higher, the underlying trend ex-noise seems to be flat, at best, and more likely downward. Investment is falling significantly. Private structure investment has fallen 10 of the last 11 quarters. Equipment spending fell 2.7% in Q2. This is a leading indicator for potential GDP. If we don’t invest today, then we will have less productive capacity tomorrow. Pullbacks in spending from Intel, Amazon, Facebook, and others suggest that spending may continue to fall heading into 2023.
The takeaway from these numbers is that Goods spending is declining fairly quickly and Services spending is unlikely to do enough to avoid overall consumption numbers from heading down in Q3. Additionally, with real average weekly earnings falling 4.4% in June (worse than -4.0% in May), it is difficult to see personal consumption heading anywhere but downward.
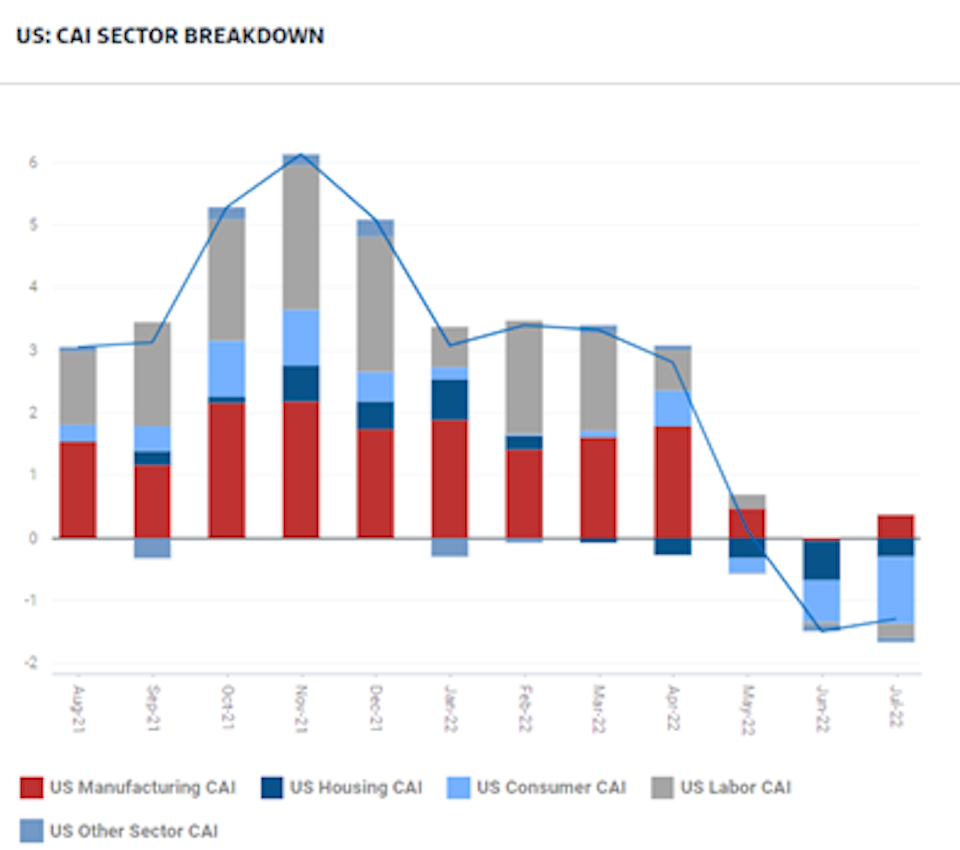
Goldman Sachs estimates that personal consumption turned negative in May and has continued to exert a bigger and bigger drag on the economy through July. Goldman uses proprietary data and analysis to measure this and it is arguably a better gauge of the economy than the national GDP numbers. (Chart 1).
And then, on the inflation front, unfortunately, while some commodity costs have declined, that is not what we are hearing from many of the companies currently reporting earnings. Procter & Gamble (PG) is exerting mid-to-high single digit price increases just this quarter and says that its competitors are exerting price increases at even higher rates. NexPoint Residential, an apartment operator, expects rent increases in the mid-to-high teens over the balance of the year. Aggregates company Martin Marietta posted 7.5% pricing growth in Q2 and expects “record second half pricing growth rates”. They have guided to 10-12% for the year, implying pricing that could be in the mid-teens for the back half for selling rocks. Your rocks are going to cost 15% more in the second half relative to last year.
Goldman Sachs expects the following inflation readings on a headline basis and core (excluding food and energy) over the balance of the year:
I wouldn’t disagree with this path. Unfortunately, I think it sets a recipe for additional Fed rate increases, which will further weigh on consumption, investment, and GDP growth.
The bottom line: Q2 may not have been as bad as feared. But I’m concerned Q3 and Q4 could be worse. We are managing portfolios in light of this.
Table 1. Source: Goldman Sachs

Chief Investment Officer, Portfolio Manager
Ben arrived at Narwhal from a small investment firm in Eugene, Oregon, where he cut his teeth investing in individual stocks, bonds and derivatives. He earned the right to use the CFA designation in 2016, holds his Series 65 license and is a certified Financial Risk Manager. Ben received a bachelor’s degree in finance from the University of Washington and a MBA from Emory University's Goizueta Business School. In his free time, he plays competitive tennis, mentors for Mentoring for Leadership and is a frequent contributor to The Investing Podcast.
At Narwhal Capital Management, you’re more than just a portfolio, and it’s not all about the numbers. Let’s start with a meeting about your needs and future goals.